A Comprehensive Guide to Debugging and Monitoring Django and Flask Web Applications
By JoeVu, at: Oct. 23, 2023, 5:51 p.m.
Estimated Reading Time: __READING_TIME__ minutes

1. Introduction
In the dynamic world of web application development, the twin practices of debugging and monitoring hold a paramount role. These essential activities ensure the reliability, performance, and functionality of your web applications. Python, as a versatile programming language, offers robust web frameworks such as Django and Flask. These frameworks simplify the process of web development, making it accessible to developers. However, the journey towards building reliable and efficient web applications doesn't end with coding alone; it also involves a thorough understanding of debugging and monitoring.
In this comprehensive guide, we embark on a journey to explore the intricacies of debugging and monitoring web applications developed with two of Python's most popular web frameworks: Django and Flask.
2. Debugging in Python
Understanding the Debugging Process in Python
Debugging is the process of identifying and resolving issues or errors in your code. It's an essential skill for every developer. In Python, the debugging process typically involves locating problematic code segments, understanding why they're problematic, and finding solutions to fix them.
Introduction to Common Debugging Tools in Python
Python equips developers with a set of tools and techniques to facilitate the debugging process. Here are some fundamental ones:
-
Print Statements for Basic Debugging: The simplest form of debugging involves inserting
printstatements at specific points in your code to display variable values, check the flow of your program, and verify if certain conditions are met. While basic, this method is effective for quick checks and simple troubleshooting.
-
Python's Built-in Debugger (pdb) for Interactive Debugging: Python features a powerful built-in debugger called
pdb. Withpdb, you can set breakpoints, step through code, inspect variables, and even execute code interactively during the debugging process. It's particularly useful for in-depth examination of code execution.
-
Advanced Debugging Tools and Techniques in Python: For more advanced debugging, consider tools like
pdb++and IPython.pdb++is an enhanced version ofpdbwith additional features such as syntax highlighting and an improved command-line interface. IPython is an enhanced interactive Python shell that provides features like code introspection, syntax highlighting, and better debugging capabilities.
-
Breakpoint (Python 3.7+): Similar to what pdb offers but newer.
3. Debugging in Django and Flask
Local Debugging Techniques for Developers
-
Using Print Statements
One of the fundamental methods for debugging in Django and Flask, as in any Python code, is the use of
printstatements. By strategically placingprintstatements within your code, you can observe the values of variables, monitor the flow of your application, and verify if specific conditions are met. While this approach is straightforward, it remains highly effective for conducting quick checks and basic troubleshooting.Consider a scenario in a Flask application where you want to inspect the value of a variable:
from flask import Flask

	app = Flask(__name)


	@app.route('/')

	def hello():

	    name = "John"

	    print(f"Hello, {name}!")

return f"Hello, {name}!" -
Employing Python's Built-in Debugger (pdb)
For more in-depth and interactive debugging, Python's built-in debugger, known as
pdb, is an invaluable tool. It enables developers to set breakpoints, step through code, inspect variables, and execute code interactively during the debugging process. This level of interactivity is particularly beneficial when investigating complex issues.To employ
pdbwithin your Django or Flask application, insert the following lines at the point where you wish to commence debugging:
import pdb # Insert this where you want to start debugging

	pdb.set_trace()
Once your code execution reaches thepdb.set_trace()line, you can employ various commands such asstep,continue, andprintto navigate and inspect your code interactively.
-
Breakpoint (introduced in Python 3.7)
The breakpoint Function: Python 3.7 and later versions introduced the built-in breakpoint function, which simplifies the process of setting breakpoints in your code. When the breakpoint function is called, it activates the Python debugger (pdb) at that point, allowing you to inspect variables and step through the code.
def some_function():

    x = 10

    breakpoint() # Activates the debugger here y = x * 2
Debugging Remotely on a Server
- Checking Error Logs
In a remote server environment, where your web application is hosted, it's essential to monitor and investigate issues. Most web servers (e.g., Apache, Nginx) and application servers (e.g., Gunicorn, uWSGI) typically log errors by default. You can review these error logs to identify issues with your Django or Flask application. The specific location of these logs depends on your server configuration.
- Enabling Debugging Flags
Both Django and Flask provide debugging modes that offer more detailed error information during development. For Django, you can set the DEBUG setting in your settings.py file to True:
DEBUG = True
In Flask, you can enable debugging by setting the debug parameter to True when creating your Flask app:
app = Flask(__name)

app.debug = True -
Utilizing Remote Debugging with pdb
When it's necessary to interactively debug code running on a remote server, Python's built-in debugger,pdb, can be your ally. Initiate your Django or Flask application with the--noreloadand--pdbflags to activate the debugger when an unhandled exception occurs:
python manage.py runserver --noreload --pdb # Django

	flask run --pdb # Flask
With this configuration, you can connect to your server via SSH and engage with the debugger when an exception is raised. This capability streamlines the process of diagnosing issues on remote servers.
4. Debugging Tools
Whether you're working with Django, Flask, or any other Python application, the availability of advanced debugging tools can make all the difference in identifying and resolving issues efficiently.
Python's Debugging Ecosystem
Python's extensive ecosystem offers a wealth of debugging tools and libraries, enhancing your debugging capabilities. Let's explore some of the key components:
-
pdb++ and IPython
-
pdb++: Building upon Python's built-in debugger (
pdb),pdb++offers enhanced features like syntax highlighting, an improved command-line interface, and better introspection capabilities. It simplifies the debugging process, making it an excellent choice for diagnosing complex issues. -
IPython: IPython is an interactive Python shell that provides code introspection, syntax highlighting, and enhanced debugging capabilities. It enables you to work with code interactively, inspect variables on-the-fly, and streamline the debugging process.
-
-
Integrated Development Environments (IDEs)
Modern integrated development environments, such as PyCharm, Visual Studio Code, and Jupyter Notebook, come equipped with integrated debugging tools. These tools provide features like code stepping, variable inspection, and real-time debugging. They often offer user-friendly graphical interfaces that simplify the understanding of your program's execution flow.
-
Third-Party Debugging Libraries
Python's popularity has spawned a variety of third-party debugging libraries that offer additional features beyond the standard library. Here are some notable examples:
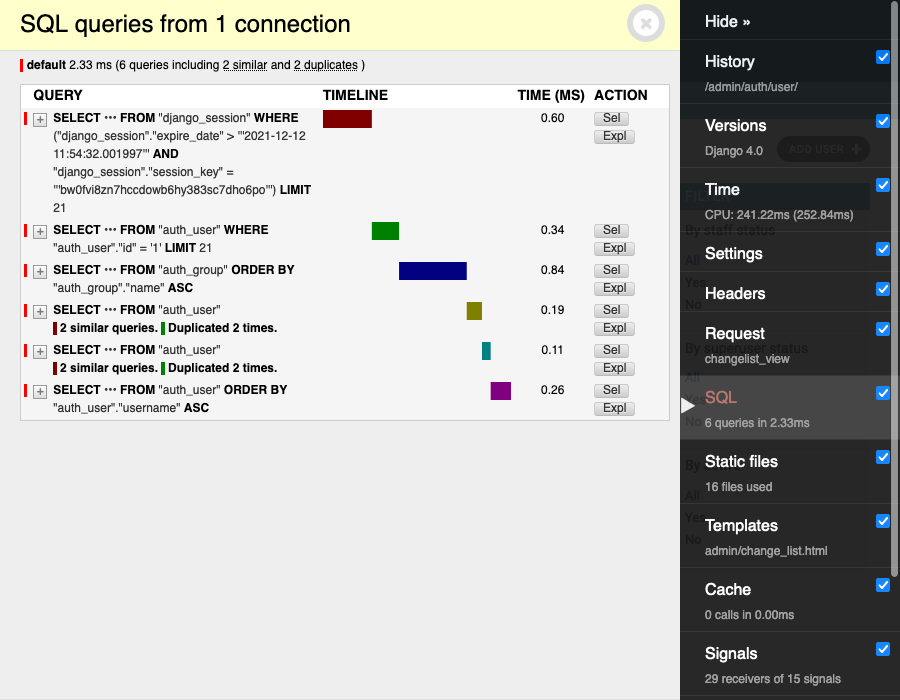
- Django Debug Toolbar: Tailored for Django developers, this debugging toolkit provides detailed information about SQL queries, HTTP requests, and template rendering. It can be a game-changer for optimizing Django applications.
These advanced debugging tools and libraries create a dynamic and powerful debugging environment. Whether you're dealing with complex code, large-scale projects, or intricate frameworks like Django and Flask, these tools can help you troubleshoot and optimize your web applications effectively.
5. Error Logging
The Importance of Error Logging
-
Python's Logging Module for Basic Logging
Effective error logging is crucial for identifying, diagnosing, and resolving issues in your Django and Flask applications. Python provides a built-in
loggingmodule that allows you to log messages, including errors, to various outputs such as files or the console. By utilizing this module, you can start basic error logging in your applications.Example of configuring a basic logger in Python:
import logging


	logging.basicConfig(filename='app.log', level=logging.ERROR)

	logger = logging.getLogger('myapp')


	try:

	    # Your code here

	except Exception as e:

logger.error("An error occurred: %s", str(e)) -
Third-Party Logging Libraries
While Python's built-in logging is sufficient for basic needs, third-party logging libraries offer more advanced features and flexibility. Here are a couple of notable options:
-
Loguru for Simplicity: Loguru is a user-friendly and versatile logging library that simplifies the configuration of loggers. It provides various output formats and allows you to control log rotation, compression, and retention.
-
structlog for Structured Logging: Structured logging with libraries like
structlogenables you to create detailed, structured logs. It's particularly useful when you need to log contextual information with your errors, making it easier to trace and diagnose issues.
-
-
Integration with Online Logging Services
Modern web applications often benefit from integrating with online logging services that provide centralized storage and management of logs. These services offer real-time monitoring, analysis, and alerting. Some popular options include:
-
Sentry for Real-Time Error Tracking: Sentry is a widely used service that specializes in real-time error tracking. It captures and reports errors in your application with detailed information, enabling you to respond to issues promptly.
-
Rollbar for Error Monitoring and Alerting: Rollbar is another comprehensive error monitoring and alerting service. It provides real-time error notifications and helps you identify and resolve issues quickly.
-
Loggly for Log Management: Loggly offers log management and analysis, allowing you to collect and centralize log data. It provides features like searching, visualizations, and alerts for effective log management.
-
6. Error Notification
The Need for Error Notifications
-
Sending Email Notifications with smtplib
Error notification is a critical aspect of maintaining the reliability of your web applications. When an error occurs, it's essential to inform the relevant parties promptly. One of the simplest ways to achieve this is by sending email notifications. Python's
smtpliblibrary enables you to send email notifications when specific errors or exceptions are detected in your Django or Flask applications.Example of sending an email notification using
smtplib:import smtplib
from email.mime.text import MIMEText
def send_error_email(subject, message):
# Your email configuration
smtp_server = "smtp.example.com"
smtp_port = 587
smtp_username = "your_username"
smtp_password = "your_password"
from_address = "[email protected]"
to_address = "[email protected]"
# Create and send the email
msg = MIMEText(message)
msg["Subject"] = subject
msg["From"] = from_address
msg["To"] = to_address
with smtplib.SMTP(smtp_server, smtp_port) as server:
server.starttls()
server.login(smtp_username, smtp_password)
server.sendmail(from_address, [to_address], msg.as_string()) -
Integration with Third-Party Communication Tools
For more efficient error notifications, consider integrating with third-party communication tools like Slack, Microsoft Teams, or PagerDuty. These platforms provide real-time communication and alerting, ensuring that the right individuals are informed as soon as an error occurs.
-
Slack: Slack offers integration options for receiving notifications from various services. You can set up webhooks to send error messages to specific Slack channels or users.
-
Microsoft Teams: Microsoft Teams also provides integration capabilities. You can configure connectors to send messages to Teams channels when specific events, such as errors, happen in your application.
-
PagerDuty: PagerDuty is a platform designed for incident response and management. It offers comprehensive alerting and on-call scheduling to ensure that the right individuals are alerted in real-time.
-
-
Asynchronous Error Notifications Using Celery and Task Queues
To enhance the efficiency of error notifications, you can implement asynchronous notifications using tools like Celery and task queues. Asynchronous processing allows your application to continue running smoothly while error notifications are dispatched in the background.
By decoupling the error notification process, your application's performance isn't impacted, and notifications can be reliably sent to the designated recipients.
7. Online Services for Debugging and Monitoring
Introduction to Online Services
-
Overview of Popular Online Services
In the era of web development, online services play a pivotal role in enhancing the debugging and monitoring of Django and Flask applications. These services offer a range of features that go beyond traditional error logging and notification, empowering developers to proactively manage, optimize, and gain valuable insights into their applications.
-
Sentry for Error Tracking
- Sentry: Sentry is a renowned online service that specializes in real-time error tracking. It seamlessly integrates with Django and Flask applications, capturing and reporting errors with exceptional detail. Sentry provides a comprehensive view of your application's health, enabling you to respond to issues promptly and maintain a seamless user experience.
- Sentry: Sentry is a renowned online service that specializes in real-time error tracking. It seamlessly integrates with Django and Flask applications, capturing and reporting errors with exceptional detail. Sentry provides a comprehensive view of your application's health, enabling you to respond to issues promptly and maintain a seamless user experience.
-
Rollbar for Real-Time Alerting
- Rollbar: Rollbar is another comprehensive error monitoring and alerting service. It excels in providing real-time error notifications, enabling you to identify and resolve issues quickly. Rollbar's integrations and flexible alerting options make it a valuable asset for Django and Flask developers.
- Rollbar: Rollbar is another comprehensive error monitoring and alerting service. It excels in providing real-time error notifications, enabling you to identify and resolve issues quickly. Rollbar's integrations and flexible alerting options make it a valuable asset for Django and Flask developers.
-
Loggly for Log Management
- Loggly: Loggly is a log management service that facilitates the collection, centralization, and analysis of log data. It offers features like searching, visualizations, and alerts for effective log management. Loggly can be integrated with Django and Flask applications to gain deep insights into your application's behavior and performance.
- Loggly: Loggly is a log management service that facilitates the collection, centralization, and analysis of log data. It offers features like searching, visualizations, and alerts for effective log management. Loggly can be integrated with Django and Flask applications to gain deep insights into your application's behavior and performance.
-
New Relic for Performance Monitoring
- New Relic: New Relic is a performance monitoring service that goes beyond error tracking. It provides in-depth insights into your application's performance, enabling you to identify bottlenecks, optimize code, and deliver an exceptional user experience. New Relic can be a valuable addition to Django and Flask applications, especially when performance is a priority.
- New Relic: New Relic is a performance monitoring service that goes beyond error tracking. It provides in-depth insights into your application's performance, enabling you to identify bottlenecks, optimize code, and deliver an exceptional user experience. New Relic can be a valuable addition to Django and Flask applications, especially when performance is a priority.
-
Datadog for Performance and Error Data
- Datadog: Datadog is a comprehensive monitoring and analytics platform that offers real-time insights into the performance and health of your applications. It can be integrated with Django and Flask to capture performance data, error metrics, and more, providing a holistic view of your application's behavior.
- Datadog: Datadog is a comprehensive monitoring and analytics platform that offers real-time insights into the performance and health of your applications. It can be integrated with Django and Flask to capture performance data, error metrics, and more, providing a holistic view of your application's behavior.
-
Raygun for Error Tracking and Reporting
- Raygun: Raygun is an error tracking and reporting service that focuses on identifying, diagnosing, and resolving issues quickly. It offers features like error grouping, user tracking, and deployment tracking, making it a powerful asset for Django and Flask developers seeking to maintain application reliability.
- Raygun: Raygun is an error tracking and reporting service that focuses on identifying, diagnosing, and resolving issues quickly. It offers features like error grouping, user tracking, and deployment tracking, making it a powerful asset for Django and Flask developers seeking to maintain application reliability.
-
Airbrake for Error Monitoring
- Airbrake: Airbrake is an error monitoring and alerting service that allows you to track and diagnose errors in real-time. It integrates seamlessly with Django and Flask applications and provides detailed insights into the root causes of errors.
- Airbrake: Airbrake is an error monitoring and alerting service that allows you to track and diagnose errors in real-time. It integrates seamlessly with Django and Flask applications and provides detailed insights into the root causes of errors.
-
AppSignal for Application Performance
- AppSignal: AppSignal is a performance monitoring and error tracking service that helps you gain insights into your application's performance and reliability. It offers a range of features, including error tracking, performance metrics, and custom event tracking, enhancing your ability to maintain a high-quality application.
- AppSignal: AppSignal is a performance monitoring and error tracking service that helps you gain insights into your application's performance and reliability. It offers a range of features, including error tracking, performance metrics, and custom event tracking, enhancing your ability to maintain a high-quality application.
-
Bugsnag for Error Tracking and Diagnosis
- Bugsnag: Bugsnag is an error tracking and diagnosis service that provides comprehensive insights into application errors. It offers real-time error monitoring, stability scores, and in-depth error diagnostics to help you keep your Django and Flask applications running smoothly.
- Bugsnag: Bugsnag is an error tracking and diagnosis service that provides comprehensive insights into application errors. It offers real-time error monitoring, stability scores, and in-depth error diagnostics to help you keep your Django and Flask applications running smoothly.
-
Google Cloud Operations Suite for Google Cloud Users
- Google Cloud Operations Suite: Google Cloud users can leverage the Google Cloud Operations Suite, which offers advanced monitoring, error tracking, and logging capabilities. It seamlessly integrates with Django and Flask applications hosted on Google Cloud, providing a robust platform for managing application performance and reliability.
8. Conclusion
In the fast-paced world of web application development, debugging and monitoring are indispensable practices. Whether you're working with the Django or Flask framework, ensuring the reliability, performance, and functionality of your web applications requires a keen understanding of these essential tasks. This comprehensive guide has explored the intricate landscape of debugging and monitoring in the context of Python's popular web frameworks.
In conclusion, it's crucial to recognize that debugging and monitoring are ongoing processes in web application development. By embracing the appropriate tools and services, you can proactively address issues, optimize performance, and provide a seamless user experience. We encourage developers to explore and integrate these tools into their workflow, making debugging and monitoring integral components of their web application development journey.
As you continue your journey in web application development with Django and Flask, remember that staying vigilant, equipped with the right tools, is the key to building robust, reliable, and high-performing applications that stand out in the dynamic landscape of the internet.