
[One Package Per Day] Django Debug Toolbar
By JoeVu, at: July 16, 2024, noon
Estimated Reading Time: __READING_TIME__ minutes
Welcome back to our "One Package Per Day" series, where we explore useful packages that can enhance your Django projects.
Today, we're diving into Django Debug Toolbarm - a powerful debugging tool that provides a configurable set of panels to display various debug information about the current request/response.
Installation
To install Django Debug Toolbar, simply use pip:
pip install django-debug-toolbar
After installation, add 'debug_toolbar' to your INSTALLED_APPS in your Django settings:
INSTALLED_APPS = [

    # Other installed apps

    'debug_toolbar',

]
Next, add the middleware:
MIDDLEWARE = [ # Other middleware 'debug_toolbar.middleware.DebugToolbarMiddleware', ]
Finally, configure the internal IPs in your settings, so it will only show in your local machine - https://django-debug-toolbar.readthedocs.io/en/latest/installation.html#configure-internal-ips
INTERNAL_IPS = [ '127.0.0.1', ]
Getting Started
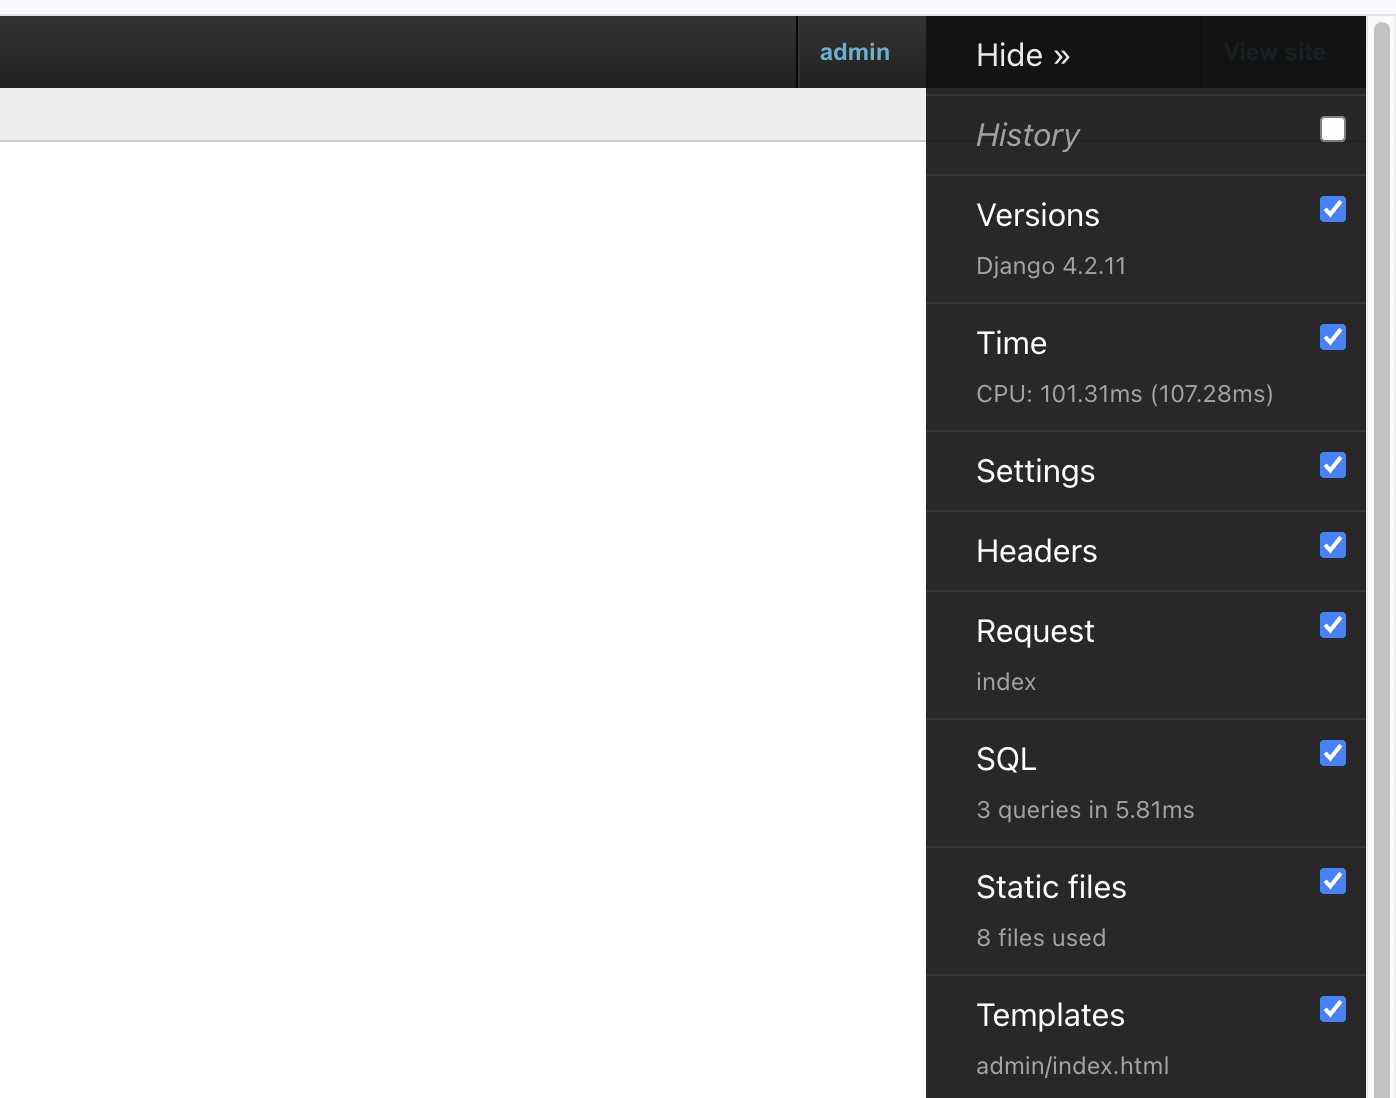
Once installed and configured, the Django Debug Toolbar will appear for any request made to the server. It will provide a sidebar with various panels containing detailed information about the request and the environment.
Key Features
- SQL Queries Panel
- Displays all SQL queries executed during the request, including timing and duplicates.
- Displays all SQL queries executed during the request, including timing and duplicates.
- Template Panel
- Shows the templates used and the context variables passed to them.
- Shows the templates used and the context variables passed to them.
- Cache Panel
- Provides details on cache usage, including hits and misses.
- Provides details on cache usage, including hits and misses.
- Signals Panel
- Lists signals sent during the request and their receivers.
- Lists signals sent during the request and their receivers.
- Logging Panel
- Displays logging output from the request.
Pros and Cons
Pros
- Provides comprehensive debugging information.
- Highly configurable and extendable with custom panels.
- Improves development efficiency by highlighting performance bottlenecks.
Cons
- Can slow down the application if too many panels are enabled.
- Should not be used in production due to security and performance concerns.
Use Cases
- Performance Tuning: Identify slow queries and optimize them.
- Template Debugging: Track which templates are being rendered and with what context.
- Cache Management: Monitor cache performance and effectiveness.
- Signal Debugging: Ensure signals are being sent and received as expected.
Best Practices
- Use the toolbar only in development environments.
- Enable only the panels you need to avoid performance overhead.
- Regularly review the SQL queries and optimize as needed.
Customization
Django Debug Toolbar can be customized by enabling/disabling panels in your settings:
DEBUG_TOOLBAR_PANELS = [

    'debug_toolbar.panels.versions.VersionsPanel',

    'debug_toolbar.panels.timer.TimerPanel',

    'debug_toolbar.panels.settings.SettingsPanel',

    # Add or remove panels as needed

]
Integration
Django Debug Toolbar integrates seamlessly with Django projects and can be used alongside other debugging and performance tools.
Performance Considerations
While the toolbar is an invaluable development tool, it can impact performance. It's advisable to enable only the necessary panels and ensure it's used only in development.
Comparison with Similar Packages
Django Debug Toolbar vs. Django Extensions:
- Django Debug Toolbar focuses on real-time debugging and performance profiling.
- Django Extensions offers a broader range of development tools beyond just debugging.
Django Debug Toolbar vs. Silk:
- Silk provides detailed profiling and inspection of requests and database queries.
- Django Debug Toolbar offers more panels and is more widely adopted in the Django community.
Other Useful Packages from the Django Community
- Django Extensions: For additional management commands and tools.
- Silk: For detailed profiling and inspection.
- Django Test Plus: For enhanced testing utilities.
Community and Documentation
Django Debug Toolbar has a robust community and comprehensive documentation available at Django Debug Toolbar Documentation. The community is active on GitHub and other forums, making it easy to find support and contribute to the project.
Conclusion
Django Debug Toolbar is a powerful and essential tool for any Django developer. It provides a wealth of information that can help you debug and optimize your applications more efficiently. Try it out in your next project and see how it can improve your development workflow.
![[One Package Per Day] - Django Notification](/media/filer_public_thumbnails/filer_public/9b/86/9b86b1fb-30ac-47d7-abff-4ca390464e65/django_notifications.png__400x240_q85_crop_subsampling-2_upscale.jpg)
![[One Day One Package] An Overview of Django Ninja](/media/filer_public_thumbnails/filer_public/cf/6f/cf6f4036-7f78-45c7-87bb-55901cc3b80f/django_ninja.png__400x240_q85_crop_subsampling-2_upscale.jpg)
![[One Package Per Day] - Django Reversion](/media/filer_public_thumbnails/filer_public/62/b1/62b10ec6-5dad-44f1-9f73-77f4e601a386/django-reversion.png__400x240_q85_crop_subsampling-2_upscale.jpg)

